Visita LCO
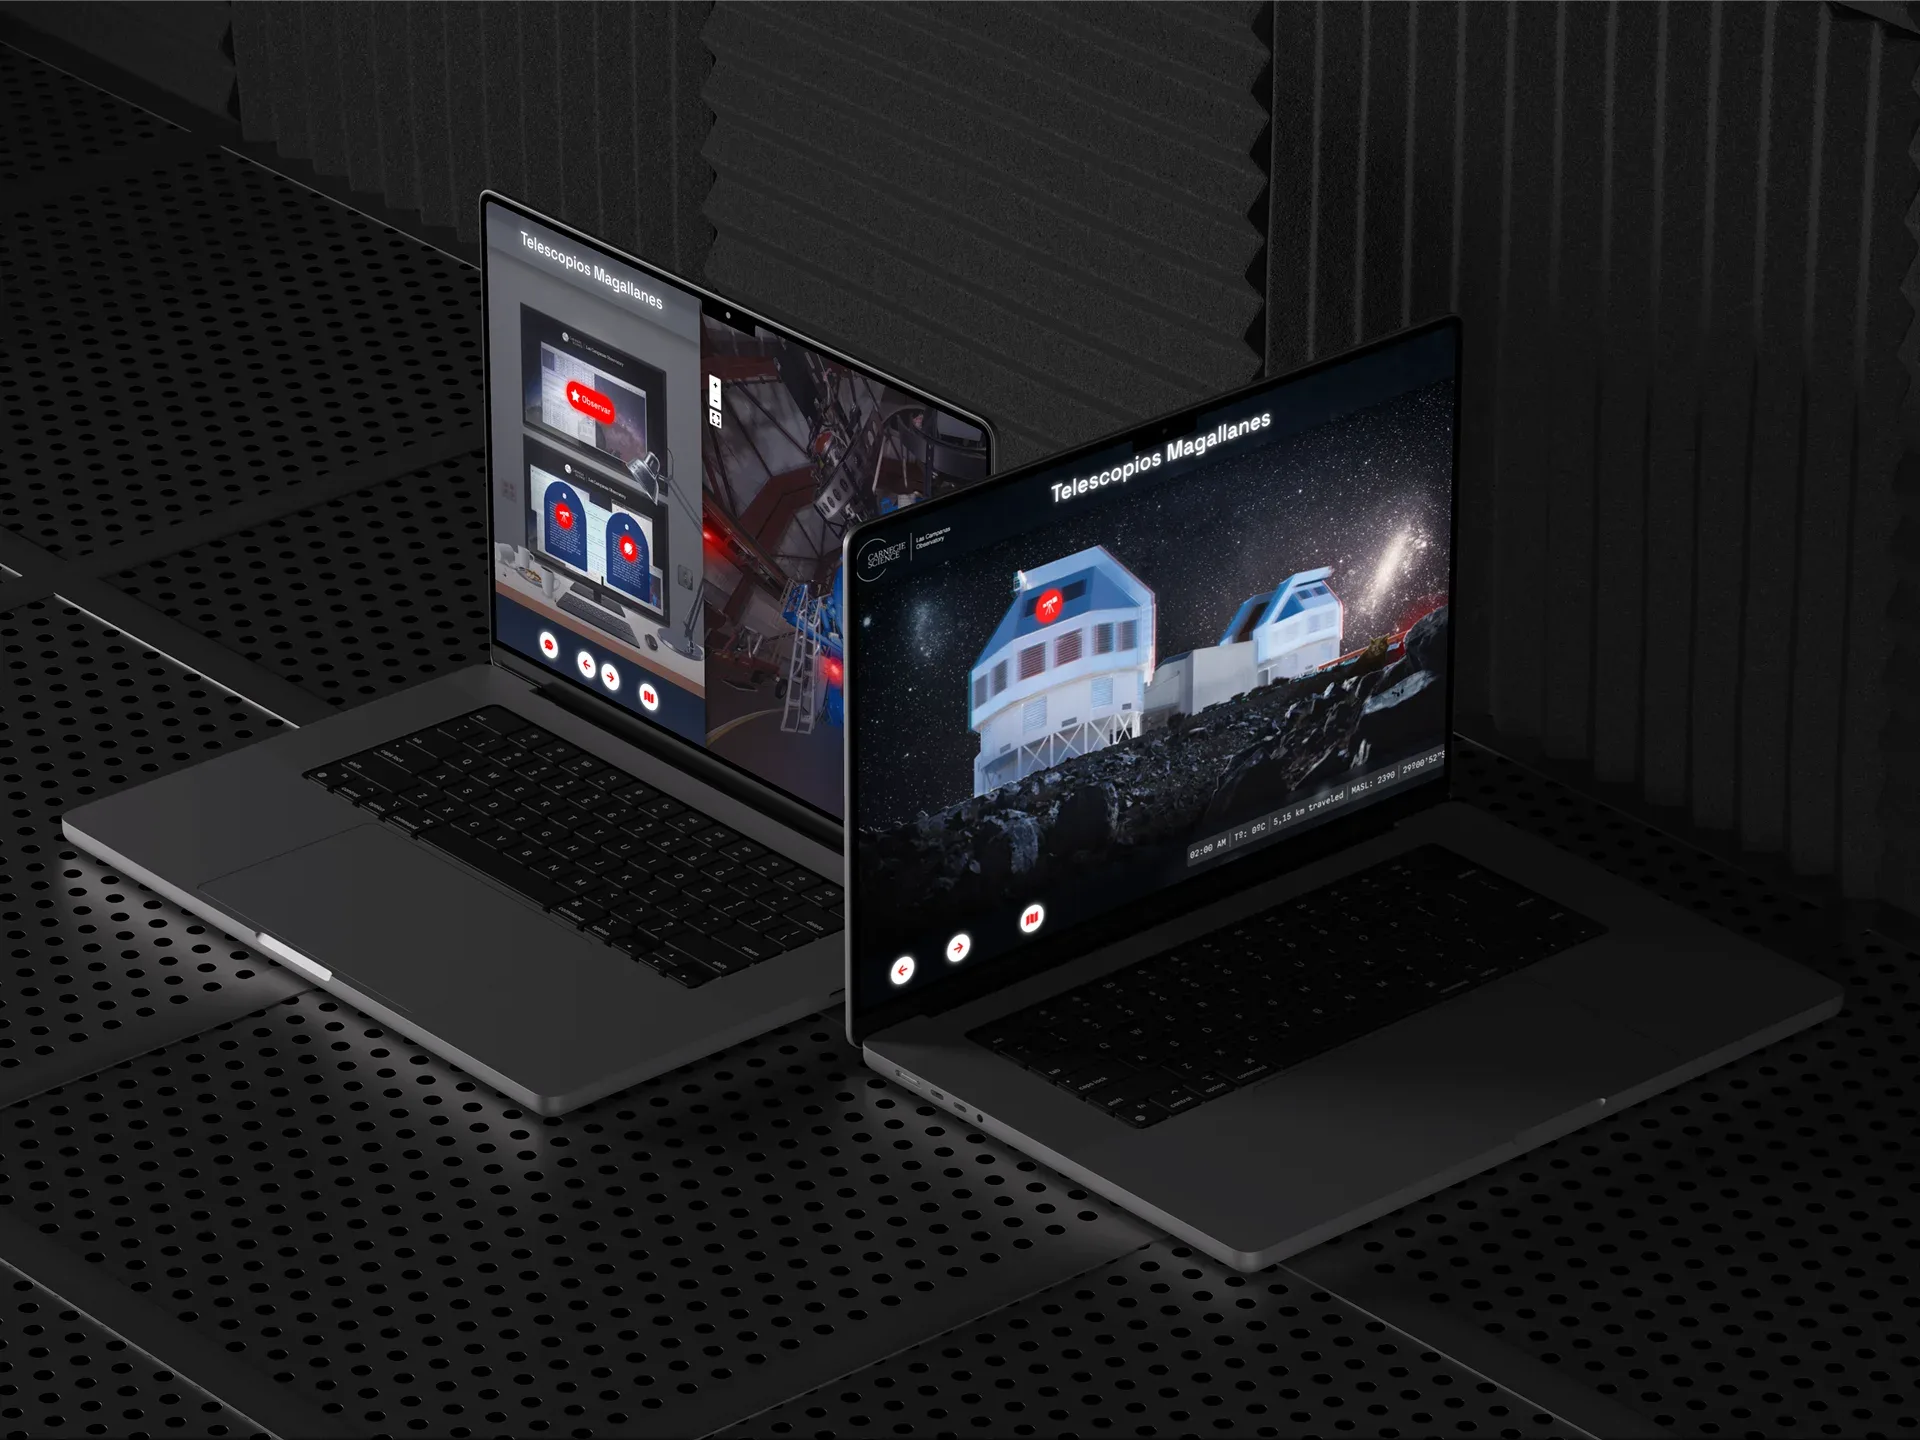
For the 50th anniversary of first light at Las Campanas Observatory, I designed and built a virtual tour that recreates a night of observation. The site opens up areas that are normally closed to the public. In two years it reached 1,900 users in 52 countries, and one in four completed the tour.
The problem
An observatory works at night, and most of its facilities can't be visited. For the anniversary, the goal was for anyone, from any country, to experience a night of observation and learn what happens inside.
I helped define the project, its scope and its goals. Then I took on the full design and development, and shot the photos and 360° panoramas of the observatory.
Process
- 50 years of first light
- 1Scope and goals
- 2Information architecture
- 3Wireframes
- 4Photography and 360° panoramas
- 5Development and interactions
The structure
The tour follows the order of a real night of observation, so the navigation reads as a journey instead of a menu.
- 1Start
- 2Arrival at the observatoryObservatory info
- 3Path to the domesInteractive activitySite info
- 4Henrietta SwopeControl roomTelescope infoTelescope 1
- 5Irénée du PontControl roomTelescope infoTelescope 2
- 6MagellanControl roomTelescopes infoTelescopes 3
- 7ExitFuture observatoryClosing message: protect dark skies
- 8CloseReview
Information architecture: eight scenes in the order of a night of observation.
The experience
My own panoramas of the observatory, also navigable with a VR headset.
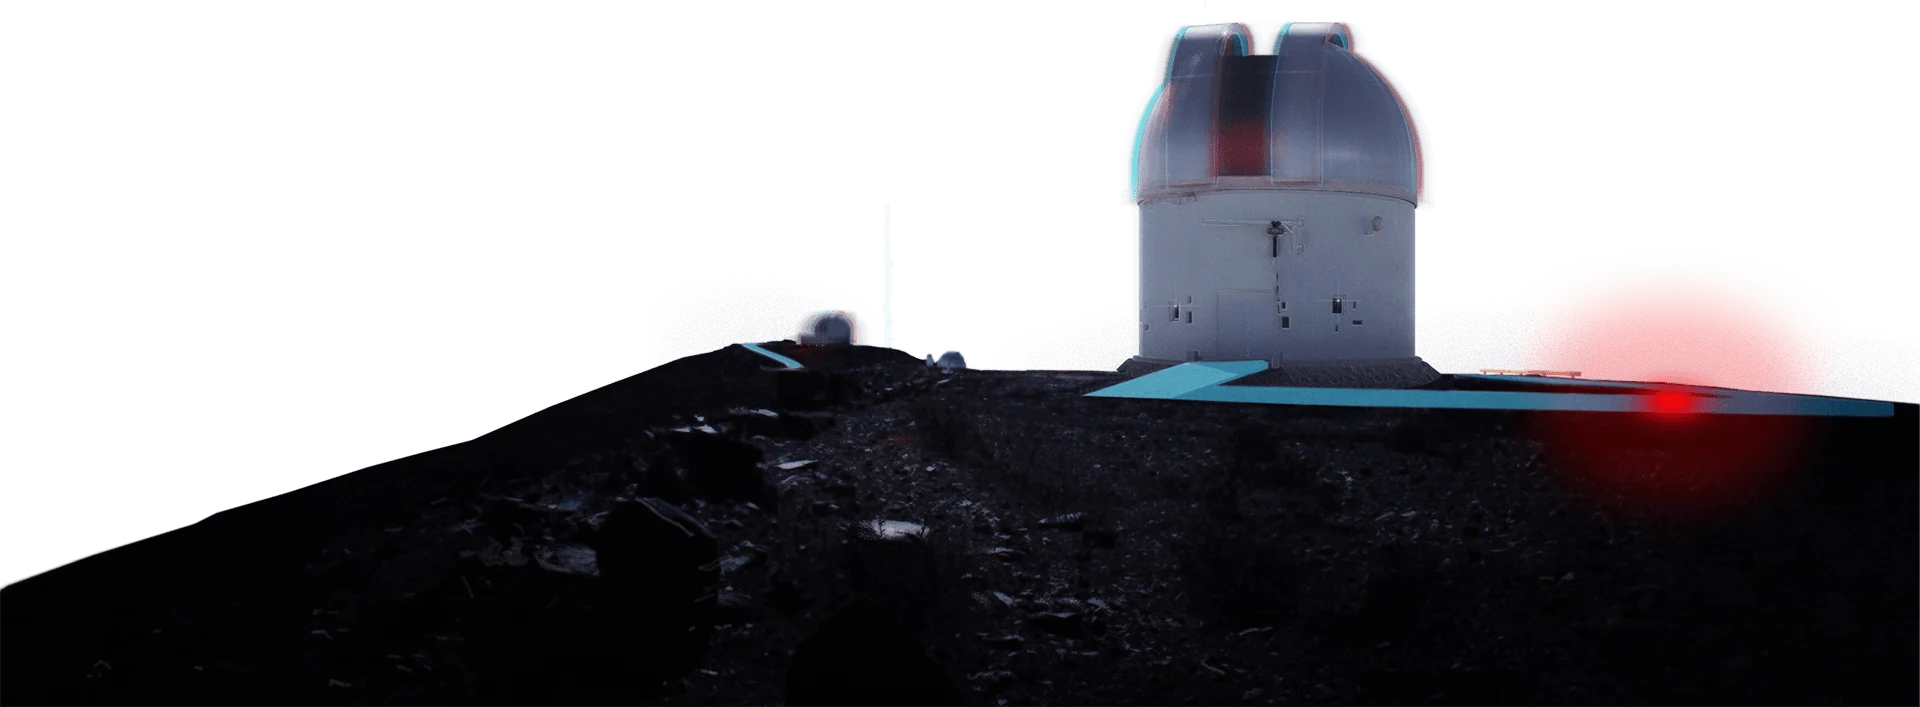
Interactions that respond to cursor movement and strengthen the feeling of exploring.
 Move the cursor anywhere
Results
I measured two goals with Google Analytics: giving people access and teaching them about the observatory, and an interface intuitive enough to encourage exploration.
users in two years, starting with 365 in the first month.
countries reached, up from 19 in the first month.
visitors completed the full tour: 26.1% over two years and 28.2% at launch.
of average engagement per visitor over two years, for a self-guided tour. Launch-month visitors stayed 3 min 56 s.
views per visitor on average, with 4.3 in the first month. People moved through several scenes per visit.
visitors opened content available only on the tour, for 1,904 views. In the first month, 136 visitors and 582 views.
The completion rate held steady while traffic grew five-fold. People who arrived long after launch still finished the experience.
First month: 7 Oct to 7 Nov 2021. Two years: 7 Oct 2021 to 3 Sep 2023.